We help Shopify brands turn attention into measurable growth
A home and lifestyle brand came to us with consistent traffic but plateaued revenue. After analyzing the on-site customer journey and addressing key conversion constraints, the store increased conversion by 43% and average order value by 28%, without increasing traffic or ad spend.
This case study demonstrates how identifying and addressing on-site conversion constraints can unlock revenue growth without increasing traffic.
Before making changes, the customer journey was analyzed to identify where conversion and order value were being limited.
Case study:
Increasing Shopify conversion by 43% without increasing traffic
From plateaued growth to validated performance
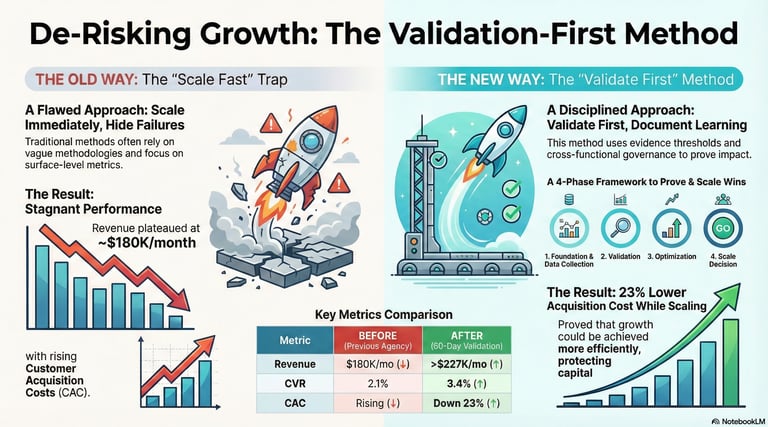
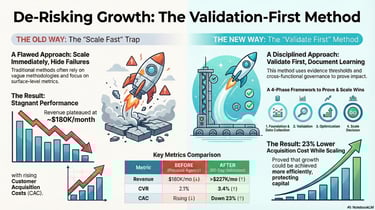
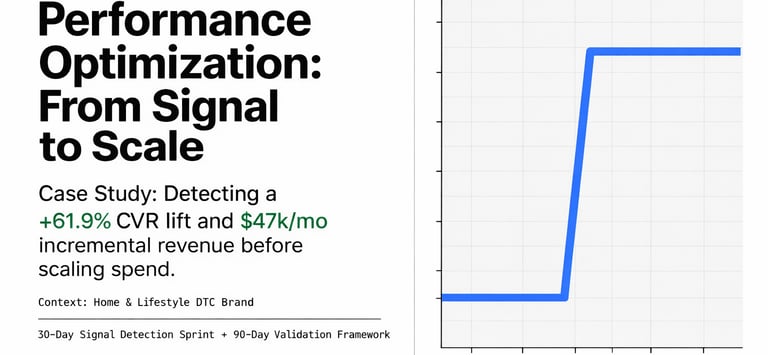
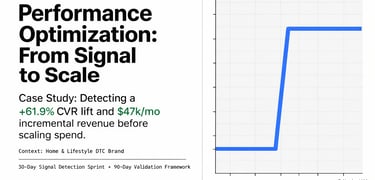
This case study documents how a Home and Lifestyle DTC brand moved from plateaued growth to a validated performance signal before increasing spend.
Instead of scaling based on attribution spikes, the work focused on identifying real economic lift and validating durability. It also protected capital through disciplined experimentation.
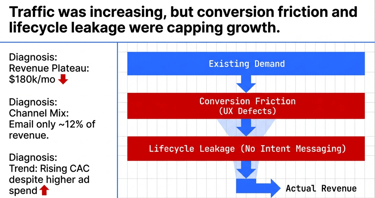
Why growth plateaued despite rising traffic
Traffic wasn't the constraint. Existing demand was being limited by conversion friction and lifecycle gaps.
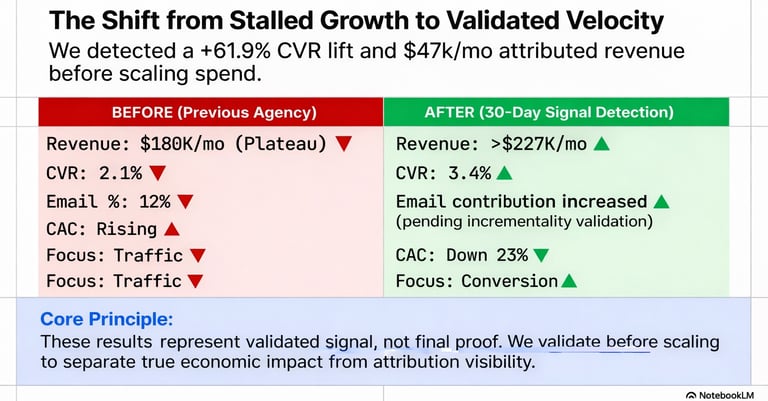
The initial diagnosis showed a revenue plateau around $180K per month, rising CAC, and email contributing only approximately 12% of revenue. Growth was capped by system inefficiencies, not acquisition volume.

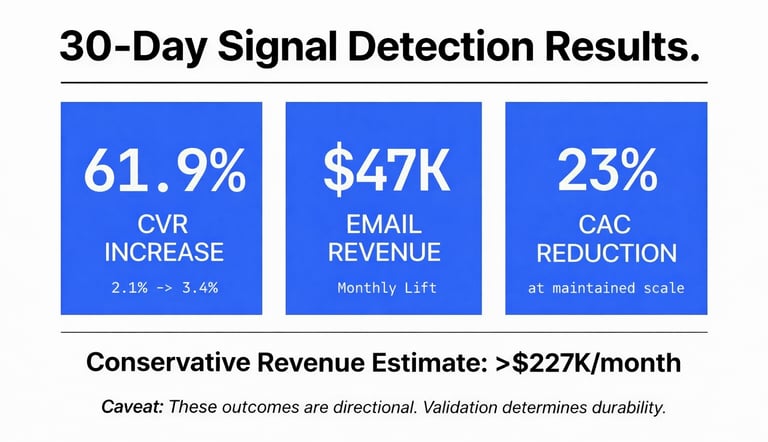
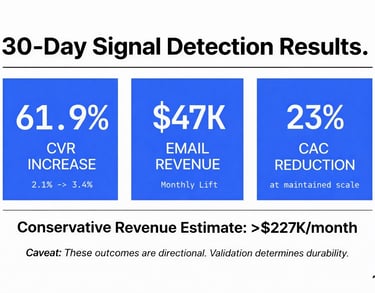
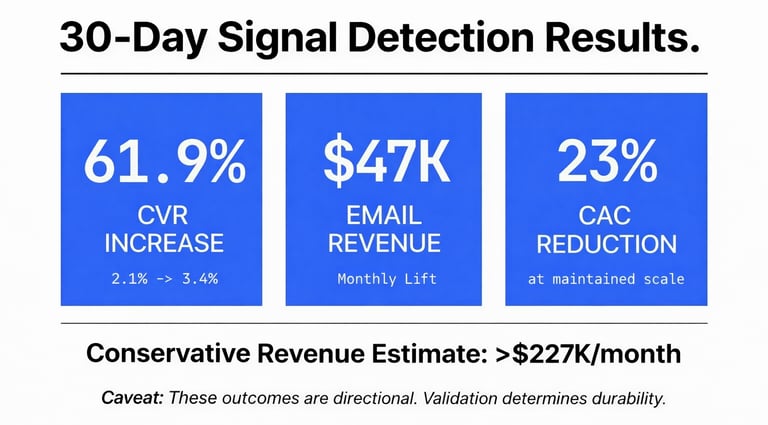
30 day signal detection results
Within 30 days, we identified a strong directional signal across conversion efficiency, lifecycle contribution, and acquisition cost.
These metrics represent detected signal, not final proof. Validation was intentionally delayed before increasing spend to separate real economic lift from attribution visibility.
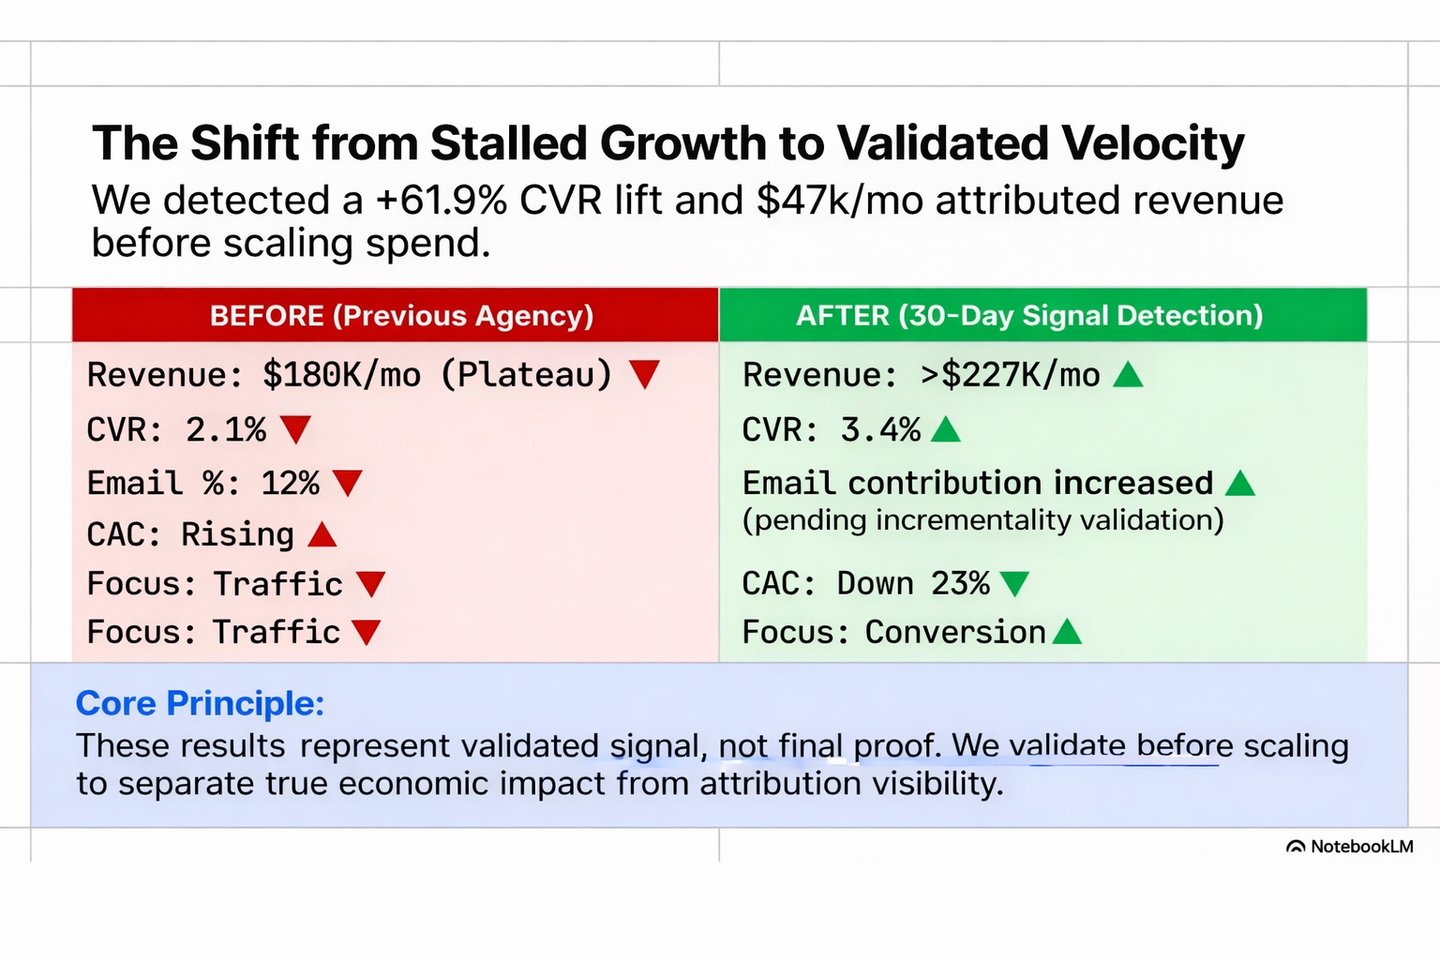
What changed and why it mattered
Before intervention, the focus was traffic driven growth with declining efficiency. After the 30 day sprint, attention shifted to conversion quality, lifecycle structure, and unit economics.
Revenue increased past $227K per month, CVR improved from 2.1% to 3.4%, and CAC declined by 23% while maintaining scale.
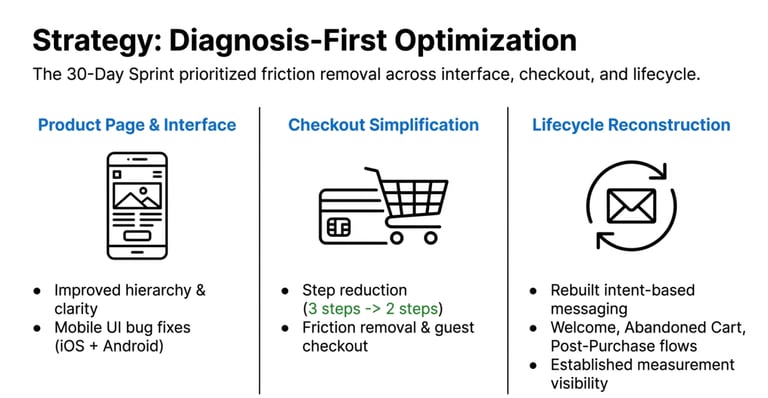
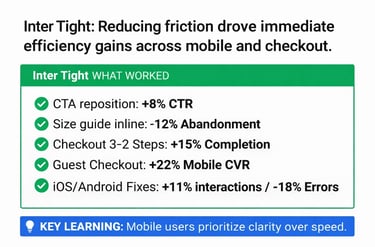
Three-pillar approach to friction removal
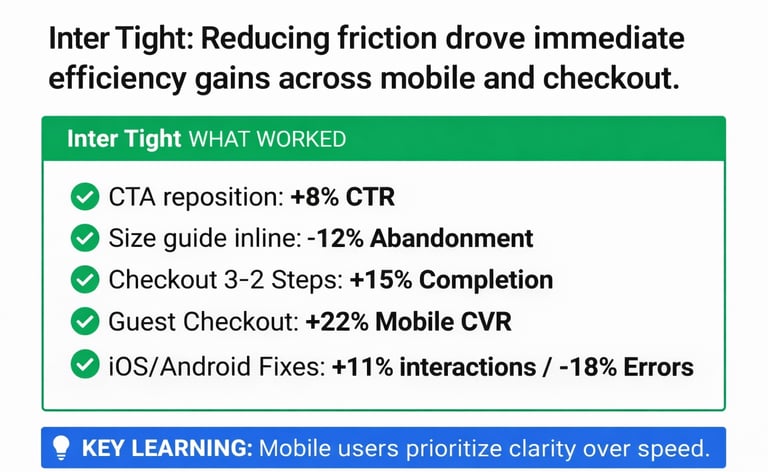
The sprint prioritized friction removal across product pages, checkout, and mobile experience. Several changes produced immediate efficiency gains, including CTA repositioning, checkout step reduction, and guest checkout enablement.
Equally important, changes that degraded experience or introduced instability were rolled back immediately. One-click checkout, dynamic pricing, and aggressive exit pop-ups were removed after negative signals appeared.
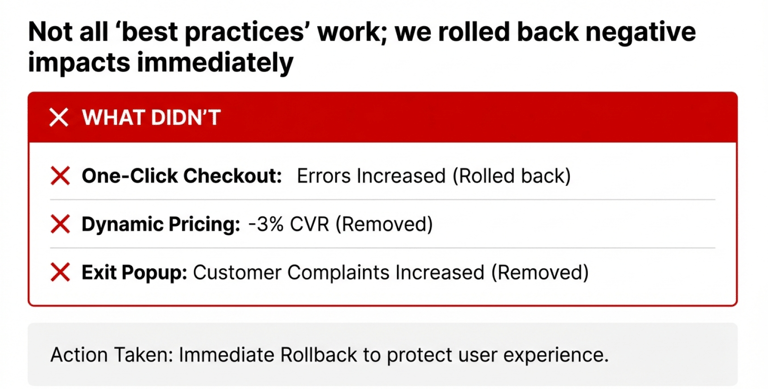

Execution decisions & rollback discipline
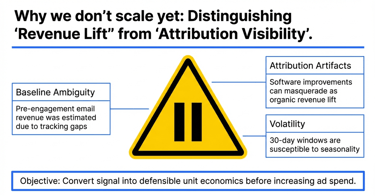
Why validation comes before scale
Detected signal does not automatically justify increased spend. Attribution artifacts, seasonality, and short windows can inflate perceived lift.

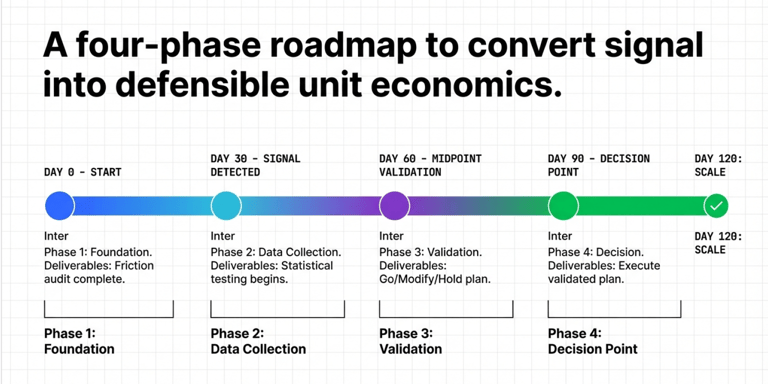
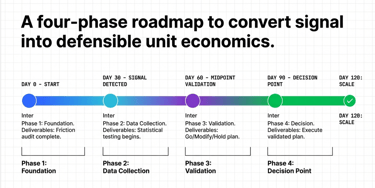
The roadmap extended beyond the initial sprint to validate durability, isolate incrementality, and confirm that gains held across time and channels before scaling decisions were made.
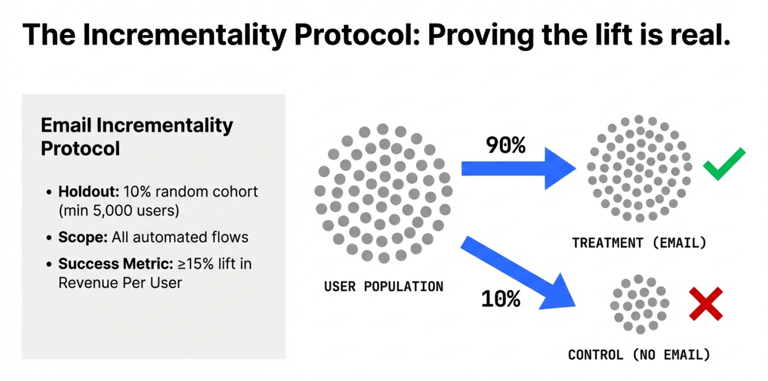

Email incrementality protocol: 90% treatment vs. 10% holdout to measure true economic lift
What qualifies as validated performance
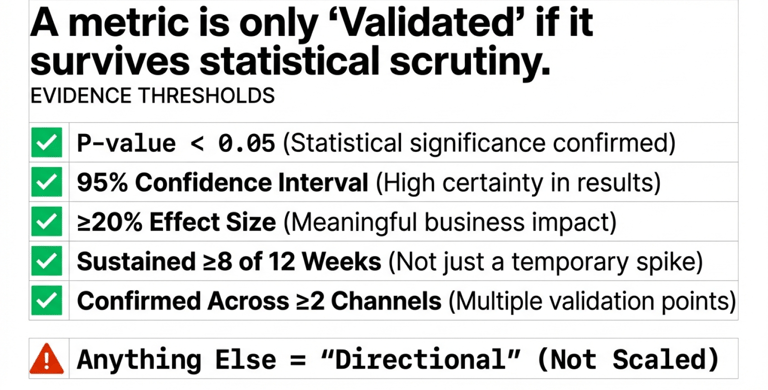
Metrics were only considered validated if they met strict evidence thresholds. These included statistical significance, meaningful effect size, sustained performance over multiple weeks, and confirmation across more than one channel.
Anything failing these thresholds was treated as directional insight and excluded from scale decisions.

Decision framework
We prepare for regression so we're never caught off guard. At Week 12, three scenarios are evaluated with pre-agreed responses:

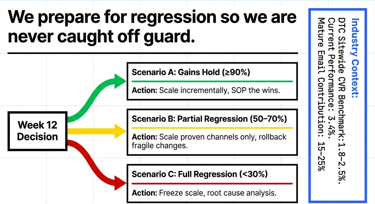
This approach ensures capital is protected regardless of whether gains hold, partially regress, or fully regress.
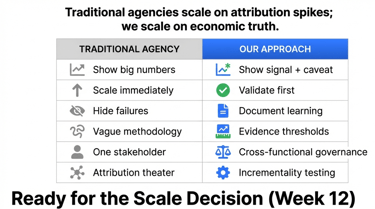
How this approach differs from standard growth execution
Rather than scaling immediately on headline numbers, this approach emphasized validation, documentation, and cross functional governance.
Failures were documented, learning was preserved, and decisions were reviewed across analytics, growth, and finance stakeholders before committing additional capital.

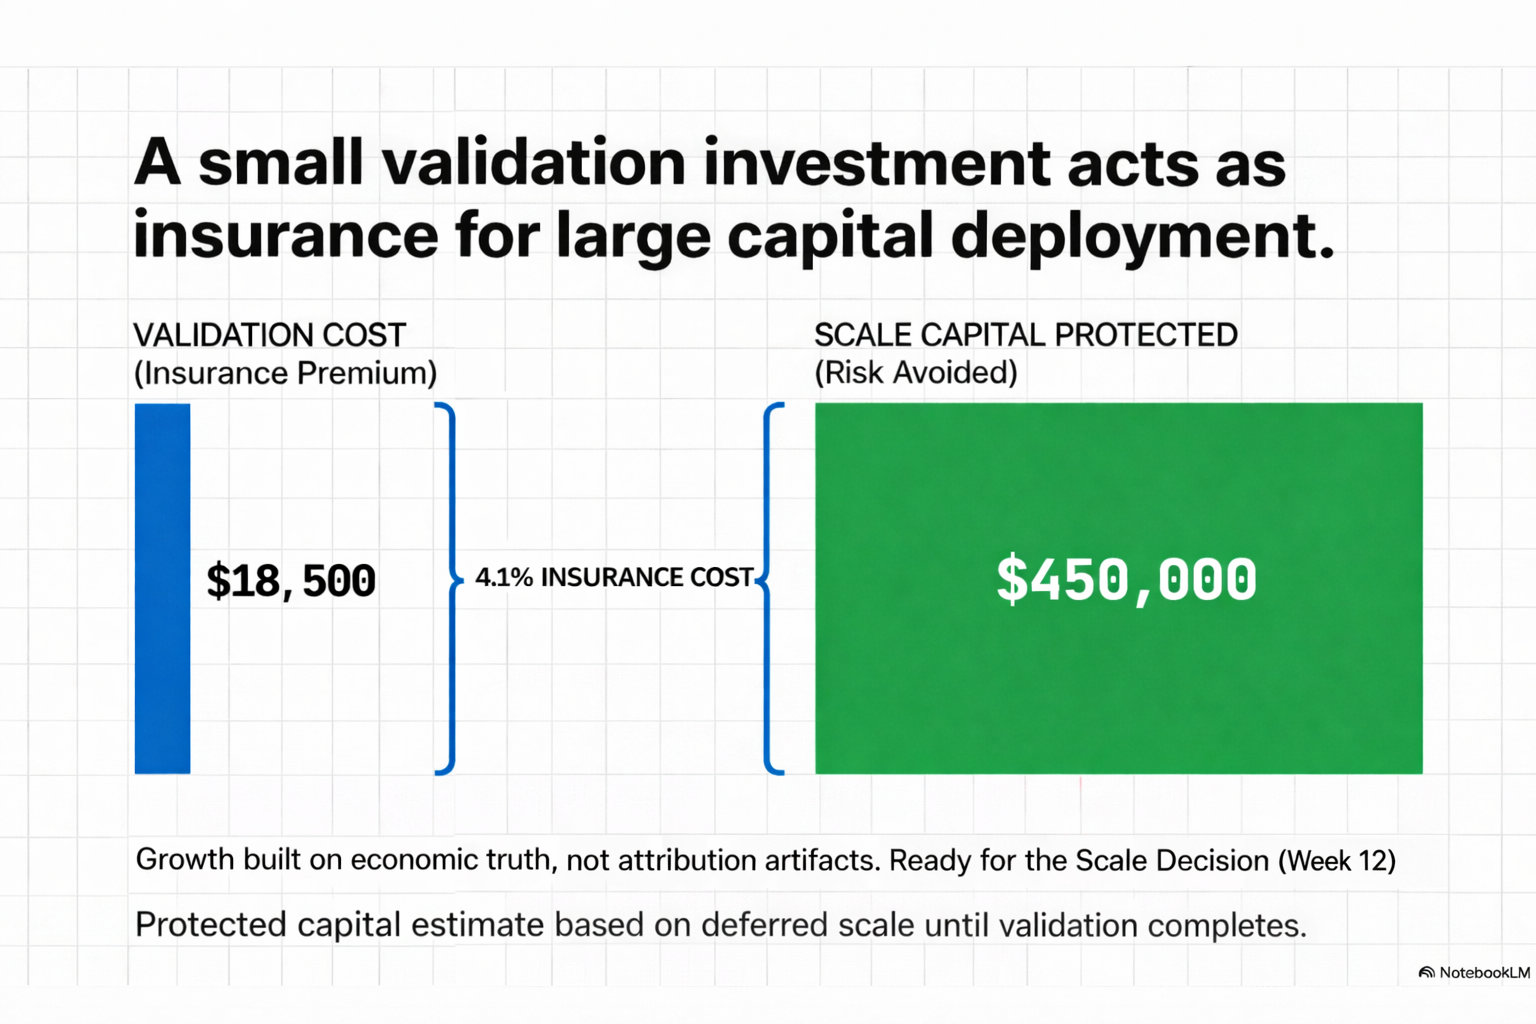
Validation as capital protection
The validation phase represented approximately a 4.1% insurance cost relative to potential scale capital.
By delaying scale until validation was complete, an estimated $450,000 in capital exposure was protected from premature deployment based on unproven signals.

Outcome
This case study demonstrates how disciplined signal detection, structured validation, and rollback governance can convert early performance gains into defensible unit economics.
The result was confidence to scale based on economic truth rather than attribution visibility.

Career & Employment Verification Inquiries
© 2026. All rights reserved.
Phone